Additional functions and capabilities of the radio frequency spectrum analysis system that significantly improve the signal search and visualization process.
Thanks to the new spectrum saving function, users can record the spectrum and view it in real-time or in “Stop” mode. Recording can be done continuously, 24/7, which allows tracking signal changes over a long period. Furthermore, the function of scrolling the spectrum and viewing individual measurements on the waterfall display is available, providing flexibility in working with data.
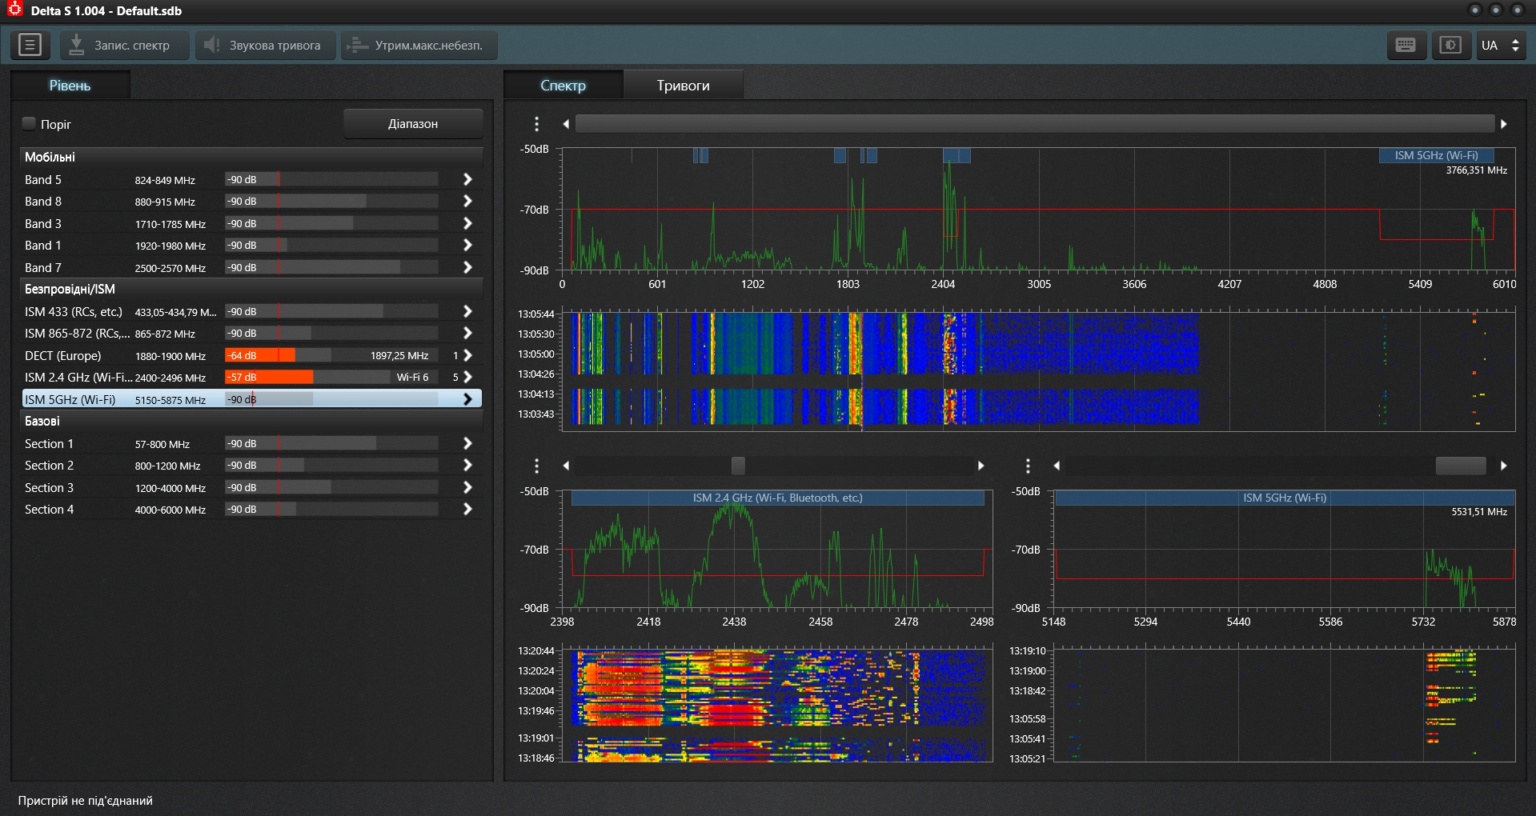
Improvements to spectrum visualization are also important. The ability to open up to three spectral panels simultaneously allows control over several ranges. Setting the maximum level and adjusting the waterfall color allow precise tuning of the system for detecting even very weak signals.
Another new feature is the scanning of Bluetooth LE devices, which allows not only searching for Wi-Fi access points but also displaying Bluetooth LE devices in real-time, with signal level measurement. This significantly simplifies the physical search for devices, as their icons shift depending on the signal level, making it possible to quickly find their location.
Spectrum Saving
- It is now possible to record the spectrum and view it on the waterfall display during the search or in “Stop” mode
- Spectrum recording can be carried out in 24/7 mode (around the clock)
- Scrolling the spectrum to a new area does not cause the waterfall display to clear if recording is in progress
- When viewing the spectrum on the waterfall display, it is possible to scroll to any desired time, select, and view an individual measurement
- The occupied disk space ranges from 1 GB to 15 GB, depending on the selected search mode
- Spectrum recording is carried out in the general search mode, as well as during the investigation of a specific range or signal
- The data file can be viewed on another computer
Spectrum Display
- Ability to open up to 3 spectral panels for simultaneous control of several ranges. The panels can be quickly configured to display areas of interest.
- The ability to set the maximum level allows configuring the spectral panels for viewing different types of signals, including very weak signals near the background level
- Adjusting the size of the spectrum and waterfall within each panel
- Adjusting the size of the spectral panels
- Adjusting the waterfall gamma allows setting the ratio of its color to the signal level
- Automatic saving of settings
Bluetooth LE Device Scanning
- In addition to Wi-Fi access points, Delta S can now scan and display Bluetooth LE devices
- The signal level is measured for each device
- Devices are displayed in the list and on the spectrum in the form of icons
- When approaching a device, its level increases, and consequently the icon shifts upwards, which simplifies physical searching (localization)
- Bluetooth LE devices that are already connected and do not announce their presence, as well as older version Bluetooth devices, are detected by the Delta S system by measuring the RF signal level on the corresponding channels
- In the spectrum, the channels of the corresponding protocol are highlighted according to the current level, which simplifies physical searching (localization)
These updates make the Delta S system a powerful tool for analyzing and localizing radio frequency signals.